Minitab, A Simple Review
So, you are considering Minitab.
You’ll be wondering if it's a good choice for you, if its feature set compares well to other options on the market, and if it is priced affordably enough for what you get.
This article will break all that down for you and more.
Plus, at the end of the article you’ll find links to alternatives to Minitab as well as our top picks for the options in this category.
Or, just go straight to Our top picks for Best analytics tools
Without further ado, let’s get started.
Minitab Features
Minitab helps organizations improve their quality and performance. It provides tools for statistical analysis, quality improvement, and data management. Minitab is a powerful data analysis and statistical software that can predict, visualize, analyze and harness the power of your data to solve complex business challenges. Minitab can look at current and past data to discover trends, find and predict behaviours, uncover hidden relations between variables and create stunning visualizations.
Minitab data analytics software is used for data analysis and quality improvement. The software is used by statisticians, quality engineers, and Six Sigma practitioners for analyzing data, findingRoot cause analysis , designing experiments, and performing process optimization.
Here are some exclusive features of Minitab:
Discover: Regardless of statistical background, Minitab empowers all parts of an organization to predict better outcomes, design better products and improve processes to generate higher revenues and reduce costs. Only Minitab offers a unique, integrated approach by providing software and services that drive business excellence.
Predict: With Minitab, you can access modern data analysis and explore your data further using advanced analytics. It enables you to skillfully predict, compare alternatives, and forecast your business with ease using Minitab's revolutionary predictive analytics techniques.
Classical Methods: Minitab allows you to use classical methods in its statistical software. You can integrate with open-source languages R or Python and boost your capabilities further with machine learning algorithms like CART TreeNet and Random Forests, now available in Minitab's module.
Find Patterns Swiftly: Minitab is a flexible and powerful tool for data analysis and scientific discovery. It allows you to quickly and easily find patterns and relationships in your data, and to build models and predictive models to better understand and predict outcomes.
Data Shaping: With Minitab, you can derive statistics, including mean, quantiles and standard deviations. You can also clean data through normalization, value handling or conversion. Minitab helps you detect out-of-range values with its anomaly detection algorithms. Additionally, Minitab lets you extract and select features to prepare your data sets.
Graphics: Minitab offers a graph builder and lets you depict data in binned scatterplots, boxplots, bubble plots, bar charts, correlograms and more. Additionally, you can use contour and rotating 3D plots to make data analysis easier. Minitab also offers probability distribution plots and automatically updates graphs according to data changes.
Achieve: Visualizations are critical; to accurately communicate discoveries and achievements. Minitab's new Interactive tool with an easy-to-browse gallery lets you view and explore multiple graph options without re-running your analysis. Minitab makes it easier to choose the best visuals for your insights.
Minitab Pricing
Minitab offers 2 Pricing options for its data analysis platform.
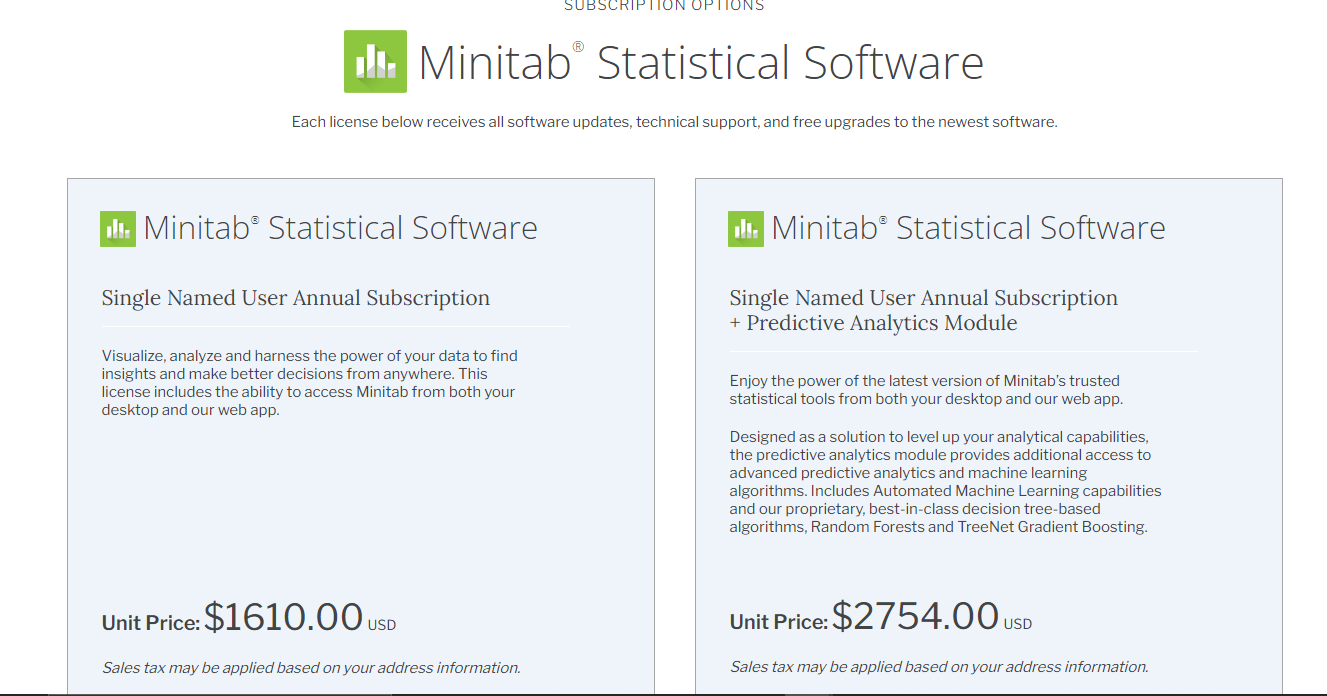
The “Single Named User” plan is priced: at $1610/year. It allows you to visualize, analyze and harness the power of your data to find insights.
The “Single Named User + Predictive analysis module” is priced at $2754/year. It offers automated machine-learning capabilities and tree-based algorithms.
Minitab Discounts and Coupons
Minitab currently does not offer any discounts or coupons for its license options.
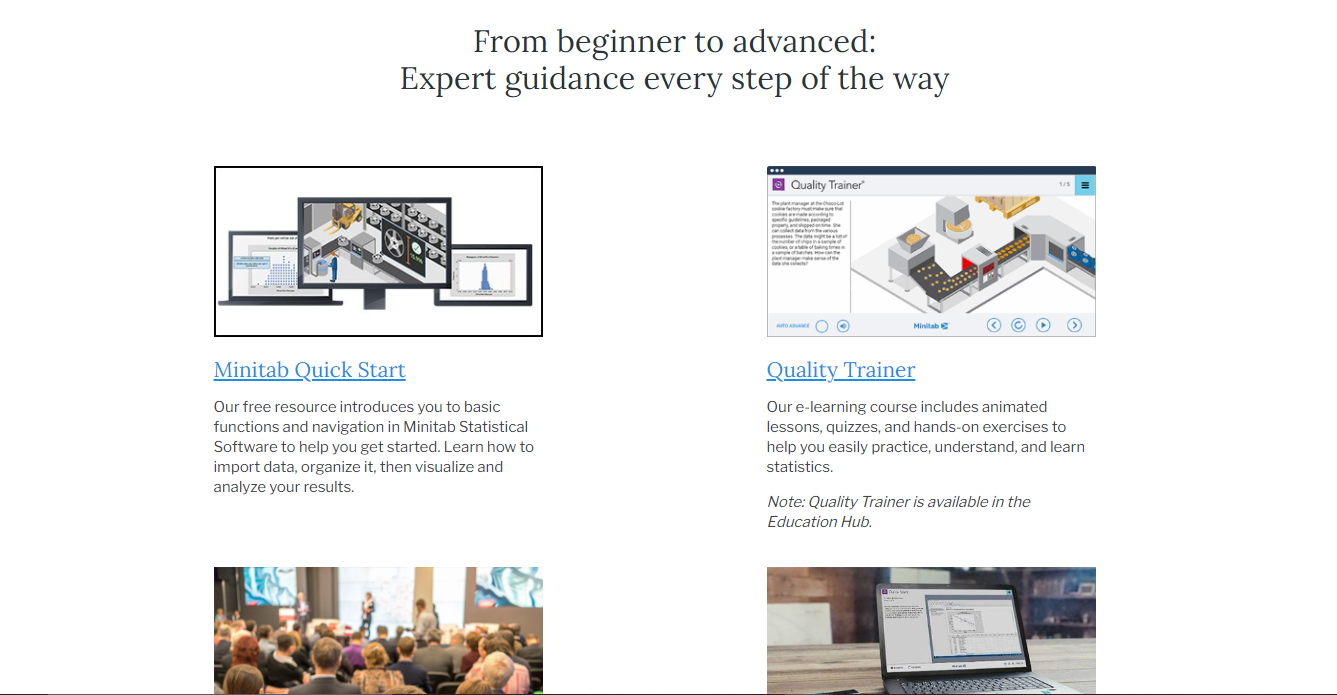
Minitab Free Trial
Minitab currently offers a 30 Day free trial for its data analytics platform.
Minitab, A short how-to guide
This guide is designed to give you an overview of how Minitab works and how to use it effectively. After completing this guide, you will be able to:
• Download and install Minitab
• Launch Minitab and open a workflow
• Configure nodes in a workflow
• Execute a workflow
• Export and share a workflow
Installing Minitab
Before you can use Minitab, you need to download and install it on your computer. Minitab is available for Windows, Mac, and Linux.
To download Minitab, go to the Minitab website and click the Download button.
On the next page, select the edition of Minitab that you want to install. For this tutorial, we will be using the Community Edition.
Click the Download button and select the installer for your operating system. Once the download is complete, launch the installer and follow the prompts to install Minitab.
Once you have Minitab installed, launch the application and you should see the “Welcome to Minitab” dialog.
From the “Welcome to Minitab” dialog, you can either choose to open an existing workflow or create a new workflow. For this tutorial, we will be creating a new workflow.
Creating and exporting a new workflow
To create a new workflow, click on the “Create new workflow” button.
This will take you to the workflow editor, which is where you will be spending most of your time in Minitab. The workflow editor is where you will be adding nodes and connecting them together to create your data analysis workflow.
Click on a data set to start analyzing it. You can right-click on a set and select combine to superimpose it with another relevant data set. You can save intermediate results by simply exporting the report while analyzing.
Click on “Workflows” to create automation workflows. Here, you can model the data analysis process for a set and put it on autopilot.
Click on algorithms to use tree algorithms for your data analysis and mining. You can tap on a data set and set the algorithm; to quickly perform the analysis and uncover insights.
Once done, save the insights by exporting reports of your data set analysis. You can then visually depict your findings.