Tableau, A Simple Review
So, you are considering Tableau.
You’ll be wondering if it's a good choice for you, if its feature set compares well to other options on the market, and if it is priced affordably enough for what you get.
This article will break all that down for you and more.
Plus, at the end of the article you’ll find links to alternatives to Tableau as well as our top picks for the options in this category.
Or, just go straight to Our top picks for Best analytics tools
Without further ado, let’s get started.
Tableau Features
Tableau is a visual analytics platform that helps you comprehend data and solve problems. Founded in 2003, Tableau is the leading data analytics software in almost every industry. With Tableau, you can formulate successful campaigns and business forecasts. It helps you derive maximum critical information from your data records.

Here are some exclusive features of Tableau:
Tableau Desktop: Tableau delivers everything you require to access and analyze your business data. You can uncover hidden business insights to make faster impactful decisions. Additionally, Tableau powers real-time data exploration by quickly building calculations from existing data. You can combine and clean data within Tableau without any coding.
Data Modeling: Tableau lets you join and blend data together without specialized data engineering teams or platform-specific technologies. It enables data teams to easily ingest, prepare, transform, visualize and augment complex data using cloud data warehouse and development workflows.
CRM Analytics: With Tableau, you can find patterns and experience actionable insights specific to your business. You can then infuse these insights into every process. Tableau drives faster decisions with AI-powered predictions and recommendations. It allows you to auto-scale across all users and leverage permissions.
Explainability: Tableau takes the guesswork out of your analytic insights, helping you quickly assess your data outcomes with easy-to-interpret analytics. You can visually summarize statistically powerful insights and surface them via new automatically created widgets. Exploration paths leverage machine learning to uncover new insights that otherwise would remain hidden.
Tableau Prep: Tableau Prep Builder offers a modern approach to data preparation, resulting in swift combining, cleaning and shaping. It provides 3 Coordinated views to show granular details. With Tableau, you can see immediate results while analyzing data and combine multiple data subsets for deeper analysis.
Embedding: Tableau lets you embed analytics within your products and applications to create a seamless analytical experience. You can embed dashboards and widgets with an iFrame HTML tag if you have no coding knowledge. Additionally, Tableau helps you rapidly build an integrated user experience that embeds analytics.
Actionable Intelligence: With Tableau's powerful AI-enhanced analytics, infusing intelligence into your business workflows is simple. You can do predictive analysis through forecasting and understand patterns in your data. Moreover, Tableau's machine learning algorithms continuously run to detect anomalies and variations in your business.
Advanced Management: Tableau offers server and cloud hosting options, allowing you to manage every aspect of the platform. With Tableau's highly configurable abilities, you can pass tough security requirements without compromising on the end-to-end experience.
Data Management: With Tableau's virtual connections, you can design and share a central access point to your data source rather than connecting several workbooks independently. It enables you to curate relevant tables for analysis and simplifies management by consolidating your data.
Tableau Pricing
Tableau offers 3 Pricing options for its data analytics platform. All subscription plans have a custom pricing option.
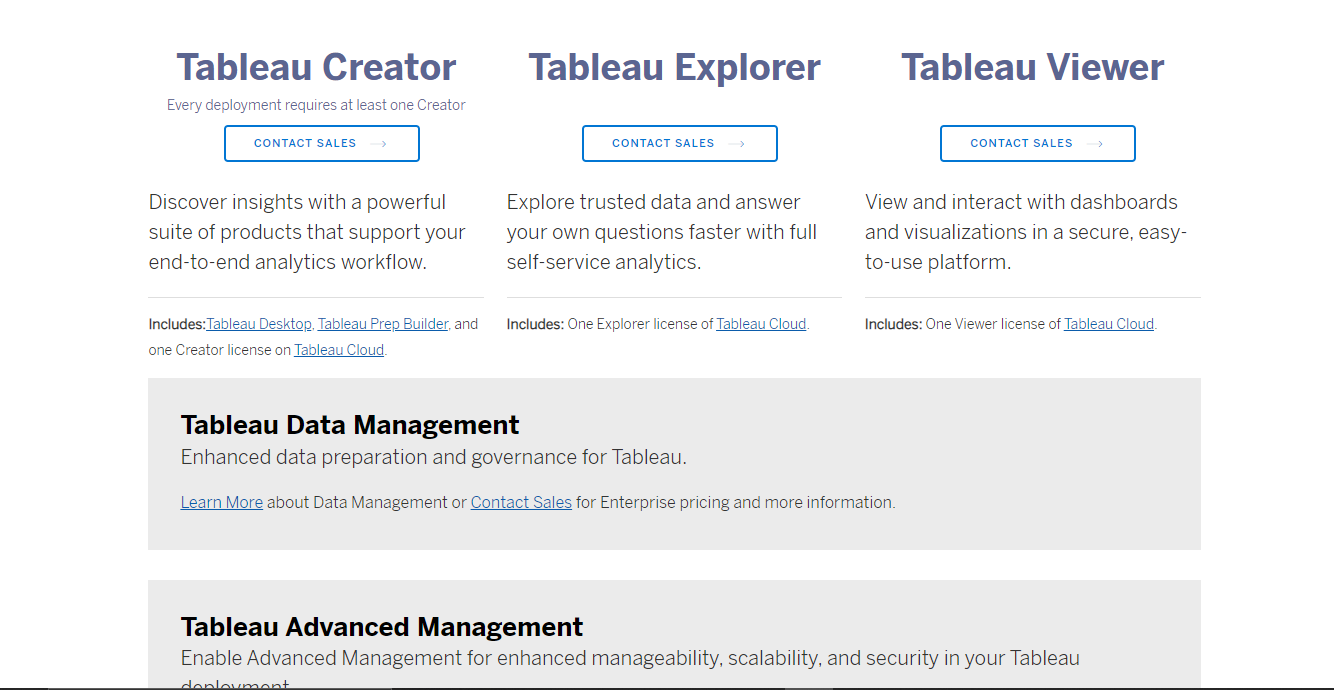
The “Creator” plan offers a prep builder, Tableau Desktop and one creator license on the cloud server.
The “Explorer” plan offers advanced management and data exploration through self-service analytics.
The “Viewer” plan allows you to interact with dashboards and create data visualizations.
Tableau Discounts and Coupons
Tableau currently does not offer any discounts or coupons for its pricing options.
Tableau Free Trial
Tableau offers a 14 Day free trial without any restrictions for its data analytics software.
Tableau, A short how-to guide
This guide is designed to give you an overview of how Tableau works and how to use it effectively. After completing this guide, you will be able to:
• Download and install Tableau
• Launch Tableau and open a workflow
• Configure nodes in a workflow
• Execute a workflow
• Export and share a workflow
Installing Tableau
Before you can use Tableau, you need to download and install it on your computer. Tableau is available for Windows, Mac, and Linux.
To download Tableau, go to the Tableau website and click the Download button.
On the next page, select the edition of Tableau that you want to install. For this tutorial, we will be using the Community Edition.
Click the Download button and select the installer for your operating system. Once the download is complete, launch the installer and follow the prompts to install Tableau.
Once you have Tableau installed, launch the application and you should see the “Welcome to Tableau” dialog.
From the “Welcome to Tableau” dialog, you can either choose to open an existing workflow or create a new workflow. For this tutorial, we will be creating a new workflow.
Creating and exporting a new workflow
To create a new workflow, click on the “Create new workflow” button.
This will take you to the workflow editor, which is where you will be spending most of your time in Tableau. The workflow editor is where you will be adding nodes and connecting them together to create your data analysis workflow.
Click on a data set to start analyzing it. You can right-click on a set and select combine to superimpose it with another relevant data set. You can save intermediate results by simply exporting the report while analyzing.
Once you login to your Tableau account, you'll be asked to import data. Once done, you can start analyzing the data set.
Next, Tableau will read the data and show worksheets so you can switch easily. You can create relationships between worksheets; to deeply analyze your data sets.
You can click on the “Connections” tab to access your data set, sort entries or get additional information.